People think they can plug their QBO or Xero into a financial dashboard app and BAM! It’s magically going to give them all the answers to run their business.
The true value of dashboarding is to visually display KPIs (Key Performance Indicators)…meaning agency metrics that matter. The data points are strategically developed and well thought out by someone who understands what numbers drive business performance — That’s what goes in your dashboard.
So, how do you create a financial dashboard that helps you see the fiscal health of your agency?
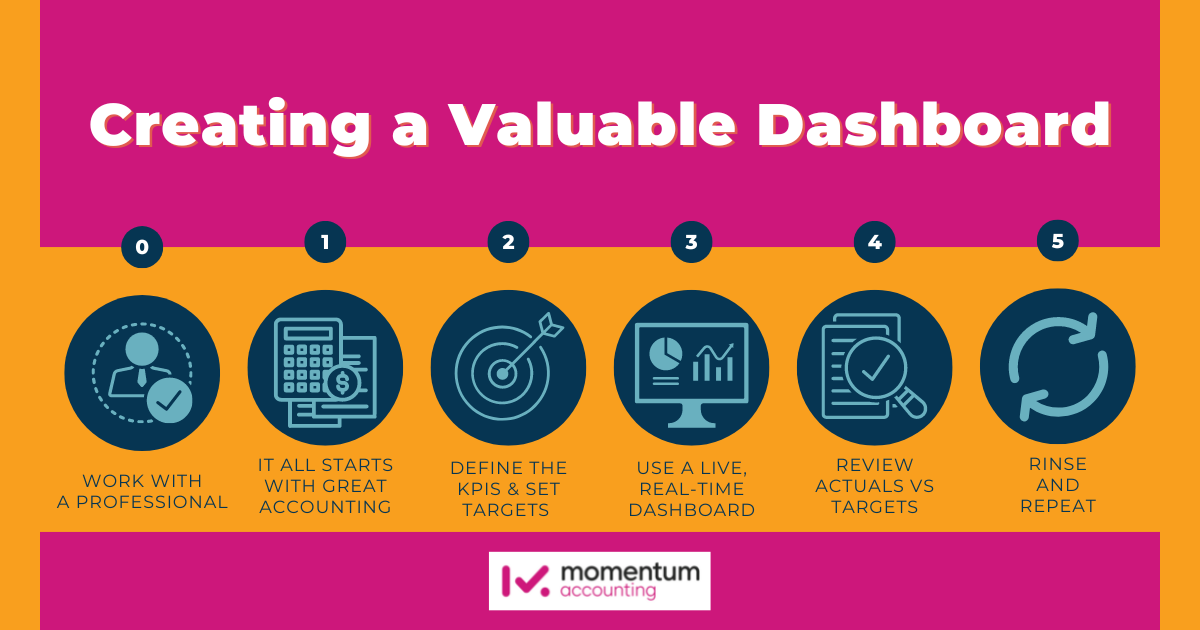
Creating a Valuable Dashboard
Step 0: Work with a professional(s) who knows what they’re doing
Dashboards, done well, are about condensing down data into a quick reference helm for running your business.
So, before you begin it’s important to find a partner to work with who’ll:
- Help you find the right metrics, KPIs, and even objectives that really make the difference in your agency.
- Set up the dashboard, connect all of your other applications, and ensure everything is syncing properly.
- Hone and fine-tune the dashboard(s) for you and other members of your team.
- Regularly review the data, provide advice, and point out issues that could cost your agency money.
Step 1: It all starts with great accounting
Your P&L is a highly valuable tool, especially if you regularly review it. There are so many case studies where we’ve saved clients thousands (even tens of thousands) by tracking and reviewing some of the most common items many businesses just don’t regularly see.
So, for the first step, setup and format the P&L — breaking down income and expenses into the following categories:
- Revenue
- Direct Costs
- Operating Expenses
- Owner Compensation
- Other income/ expenses (for non-recurring)
Step 2: Define the KPIs & set targets.
As with much data, not all of it is as useful as you think. Sometimes it’s fun to track certain things, but we need to ensure each metric and KPI we gauge directly impacts the health of the business.
An example of a few KPIs to track:
- Gross profit percentage: The amount of profit you have left over after you figure the cost of your services.
- Revenue per direct full-time employee (FTE): Your overall income divided by the number of employees who do the client work. (So $1,000,000 in revenue and 5 FTEs = $200,000 rev per FTE).
- Cash to the owner: The reasonable salary paid to the owner (from the P&L), plus the owner draws from the business.
Key point: KPI development is the most important part of this process.
There are some KPIs that are important to track across all businesses (like gross profit %) and then there are some that are customized and unique for each business, for instance, specific metrics to gauge cash management.
KPI development can take a few months as the professional is learning about the business.
A business is like an onion, you have to peel back all the layers to get to the heart of any problems. This takes time and commitment from the owner(s). You must be patient as the professional learns more and more about the business.
Step 3: Use a Live, Real-Time Dashboard
Build the KPIs using a dashboard app that pulls in live QBO/ Xero and Gusto/payroll data so your numbers are always up to date. At Momentum, we use and LOVE Reach Reporting.
If you want to look into that more, here are some user reviews from Capterra.
This is where our “step zero” comes into play. Having a partner to help you choose those metrics to include (and who understands how to quickly get all your apps working together) allows you to benefit from financial dashboarding sooner than doing it on your own.
Step 4: Review actuals vs targets
Investigate anything that does not align with expectations.
Example: Your gross profit percentage target is 50%. BUT your current gross profit is 70%.
Before you get so excited about crushing your goal — Make sure your delivery team is not being overworked.
A higher than expected gross profit % could indicate a capacity problem and might be a leading indicator of people quitting. Hustle is great, but prolonged capacity overload often equals long term problems.
On the other hand — if you’re significantly under 50% — that’s likely due to efficiency or pricing problems.
Step 5: Rinse and repeat
As the CEO, YOU are always accountable for knowing why there is a variance (whether those variances are in your goals or other key tracked metrics).
With financial dashboarding (done well), your numbers tell the story. The thing is — You can’t see issues unless you’re reading it.
Using your dashboard as a tool to investigate your business operations allows you to see the variances. Then, you dig deeper; finding, fixing, and iterating key issues. As you review, you’ll inevitably tweak your KPIs (as needed) so you’re always staying on top of what’s important.
Ready for Step Zero?
We’re ready to see where you’re at, find the right metrics for your agency, and quickly get your dashboard rolling.
If you’re ready to take a few minutes to see whether Momentum and your business are a fit, we’d love to discuss how our tech implementation and accounting services help service-based businesses.